| Fundamentals of Statistics contains material of various lectures and courses of H. Lohninger on statistics, data analysis and chemometrics......click here for more. |

|

Home  Bivariate Data Bivariate Data  Curve Fitting Curve Fitting  Curve Fitting Curve Fitting |
|||||
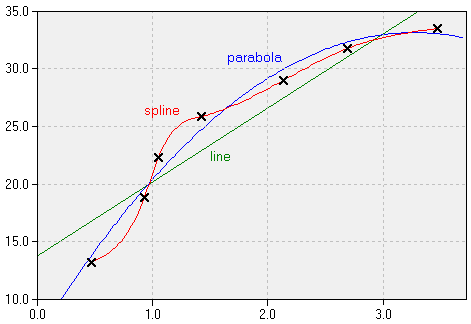
Curve FittingLet us assume that we have measured seven data points which are to be used for a calibration. This means that we have to find a curve which reflects the relationship of the measured variable (for example, the absorption at a particular wavelength) to the one we are actually interested in (e.g. the concentration of a chemical substance).
Depending on the kind of relationship (if we know it at all) we may fit a suitable mathematical function to the measured points. In many cases this function simply will be a straight line (which is fit to the data by means of regression). However, in practical situations the relationship may be of non-linear nature, resulting in a curved line through the measured values. Here we have to distinguish two fundamentally different approaches: on one hand we may fit the curve by means of linear regression, on the other hand we may wish to find a curve which includes all data points, even if they are noisy and contain some error. In principle, we find that the curve will fit the better the higher the number of degrees of freedom is. However, a better fit does not necessarily mean a better model which delivers estimates which are more reliable. In most cases the overfitting results in less reliable estimates (especially in regions where extrapolation occurs).
|
|||||
Home  Bivariate Data Bivariate Data  Curve Fitting Curve Fitting  Curve Fitting Curve Fitting |
|||||


