| Fundamentals of Statistics contains material of various lectures and courses of H. Lohninger on statistics, data analysis and chemometrics......click here for more. |

|
Home  Bivariate Data Correlation Distribution of the Correlation Coefficient Bivariate Data Correlation Distribution of the Correlation Coefficient |
||||
| See also: correlation coefficient, random variable, chance correlation, testing the significance of r |   |
|||
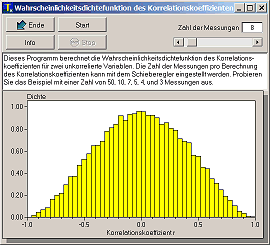
Distribution of the Correlation Coefficient
As the measurement of many samples is time-consuming, we measure only a small number of values (i.e. five) and calculate the correlation coefficient of these five pairs of values. The measurement of this small amount of values will be repeated several times. We will see, that the actual correlation coefficient as determined from this small samples will considerably deviate from the expected value of zero. If we repeat this experiement often enough we can plot the frequencies of occurence in a histogram showing the distribution of the correlation coefficient (see simulation at the right). The correlation coefficient r is a random variable, thus having a distribution function which depends on the population value of the correlation coefficient ρ and the number of samples n.
As a consequence of this effect, one has to test for the significance of a correlation coefficient. There's a rule of thumb which gives a guideline: if we have 10 pairs of observations the correlation coefficient has to exceed 0.8 to be significant, for 20 pairs this limit is around 0.5.
|
||||
| Home Bivariate Data Correlation Distribution of the Correlation Coefficient |
|
|||